How to make the Mandelbrot fractal
I will describe what this is and how it works before showing you some
source code to make one, written in Java and code for the Casio
calculators.
What is the Mandelbrot fractal?
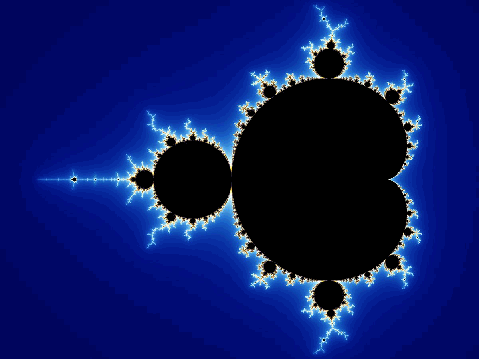
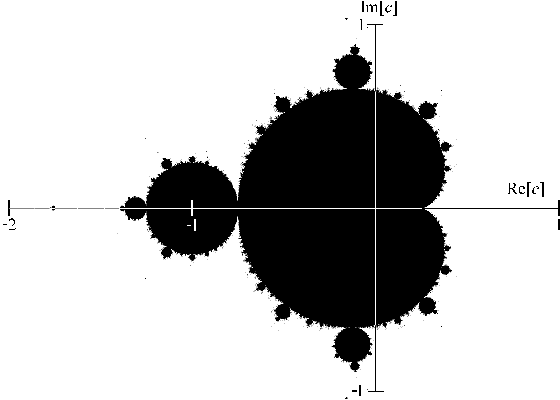
What you are looking at is a graph of the results of a simple equation.
The graph is a set of complex numbers. You take each number to examine (corresponding to a pixel) and perform
a simple equation a number of times to see if it grows towards infinity
(which you could colour white) otherwise colour it black:
The set is closely related to the Julia set (which generates similarly
complex shapes), and is named after the mathematician Benoît
Mandelbrot, who studied and popularized it.
More colourful fractals are used where the colour indicates how quickly the result grows towards infinity.
The equation used is:
zn+1 = zn2
+ c
Set z0 = 0 and c
to a point on the graph. Keep
applying the equation until |z|>2 (meaning it is not in the
Mandelbrot set) or you have iterated a certain number of times (meaning
that it is).
It is a bit like if you take a number and repeatedly square it. If you
keep squaring 2, this happens:
2, 4, 16, 256, 65536, ...
As you can see this grows towards infinity so colour it white.
Le'ts do it to 0.5:
0.5, 0.25, 0.0625, ...
This grows towards 0 so colour it black.
Let's do it to the number 1
1, 1, 1, 1, ...
Colour this black also
Source code
What I will show you first is the one for the Casio calculator as you
may see how it is made, even if you do not completely understand the
code. Note that it generates this fractal incredibly slowly.
ViewWindow -2,1.5,.5,-1.5,1.5,.5
For Ymin→T To Ymax Step (Ymax-Ymin)÷62
For Xmin→S To Xmax Step (Xmax-Xmin)÷125
S+Ti→C~D
1→I
Do
C2+D→C
1+I→I
LpWhile Abs C≤2 And I<20
Abs C≤2⇒Plot S,T
Next
Next
Here is a code fragment written in Java (easily converted to C++)
class MandelbrotPanel extends JPanel
{
public static final int MAX_ITERATIONS=256;
//maximum 256 for a palette from 0 to 255
public void paintComponent(Graphics g)
{
//Range of the graph
float
GraphTop=1.5F,GraphBottom=-1.5F,GraphLeft=-2F,GraphRight=1.5F;
int x,y,iterations; //x and y are the current pixel to draw
Rectangle r = getBounds();//this is just to get the applet dimensions
float IncrementX=((GraphRight-GraphLeft)/(r.width-1));//this is the
increment on the graph corresponding to one pixel
float DecrementY=((GraphTop-GraphBottom)/(r.height-1));
float Zx,Zy,CoordReal,CoordImaginary=GraphTop,SquaredX,SquaredY;
int palette[] = new int[256];
for(int n=0;n<256;n++)
{
//I am making a palette which is non-linear to make it brighter
palette[n]=(int)(n+512-512*Math.exp(-n/50.0)/3.0);
palette[n]=palette[n]<<16 |
palette[n]<<8 | palette[n];
/*
* The maximum value should be
255.??? so the (int) conversion
* should give 255 as the
maximum value
*/
}
palette[255]=0;
//The last colour index is for values clearly within the Mandelbrot
set, coloured black
/*
CoordReal and CoordImaginary are the variables of the point on the
graph. Remember that (0,0) on the screen correspond to GraphLeft,GraphTop.
SquaredX and SquaredY are used just to speed up the program
*/
for(y=0;y<r.height;y++)
{
CoordReal=GraphLeft;//reset the variable
when you start a new line
for(x=0;x<r.width;x++)
{
iterations=0;
Zx=CoordReal;Zy=CoordImaginary;//prepare to calculate z^2 + c
SquaredX=Zx*Zx;SquaredY=Zy*Zy; //set the initial squares
do
{
Zy=Zx*Zy;
Zy=Zy+Zy+CoordImaginary;//adding Zy to
itself removes a slower times two multiply operation
Zx=SquaredX-SquaredY+CoordReal;
SquaredX=Zx*Zx;SquaredY=Zy*Zy;
iterations++;
}while((iterations<MAX_ITERATIONS)&&((SquaredX+SquaredY)<4.0));
//Squareroot(n) < 2 squaring both sides gives n < 4
iterations--;//iterations would've otherwise been from 1 to
MAX_ITERATIONS
g.setColor(new
Color(palette[iterations]));
g.drawLine(x,y,x,y);//This plots one pixel, use a different command
CoordReal+=IncrementX;//Increment to the next place on the graph
}
CoordImaginary-=DecrementY;//Go down one
line on the graph
}
}
}
I have made a non-linear palette just to brighten it up. It is made
just for 256 iterations only so if you lessen the iterations, you
should change this.
I made this to iterate a maximum of 256 times but you can do one that
iterates 50 times with perfectly good results and of course it will be faster.
I have set a variable to Zx*Zy just so I do not have to multiply these
again in the loop.
Now, to square a complex number, I expand this equation:
(Zx + Zyi)2 =
Zx × Zx + Zx × Zy +Zx × Zy - Zy×Zy =
Zx2-Zy2 + 2(Zx×Zy)
The real part is Zx2-Zy2. It is quicker to multiply them together (the Zx*Zx part) than use a function for raising a number to another.
The
imaginary part is 2(Zx×Zy). It is quicker to set a variable
n = Zx*Zy then set n = n + n to avoid multiplying by two (adding is
quicker than multiplying). Zy is a floating point number so I cannot do
a bit shift left to multiply by two.
Have you found an error or do you want to add more
information to these pages?
You can contact me at the bottom of the home page.
|


